
Editor’s note: This post was originally published on whitehouse.gov by Lisa Gelobter, the Chief Digital Service Officer at the U.S. Department of Education. 18F team members Sarah Allen, Shawn Allen, Michelle Herzfeld, and Yoz Grahame along with Noah Kunin, Ozzy Johnson, Diego Mayer-Cantu, and Holly Allen worked with Lisa and the rest of the team from the U.S. Digital Service and the Education Department to develop College Scorecard.
My niece is a smart kid. I’m biased, but I swear she is.
Just as I started working on the College Scorecard project as the new Chief Digital Service Officer at the Department of Education, I got a call from her — she was trying to decide where to go to school. As we were building this tool, wading through this data, and working with all the top college choice tools already in the market, I was also helping her navigate her college choice process. Where should she go? What was the best value? What is value when it comes to schools? This may be the single most important investment of her life, and even she was struggling to find clear, reliable data on critical questions.
So that’s why today, I’m excited to share that Department of Education is announcing new steps to help students, parents and advisers make better college choices, including:
A new, redesigned College Scorecard. We received direct input from students, families, and their advisers to provide the clearest, most accessible, and reliable national data on college cost, graduation, debt, and post-college earnings. This new College Scorecard can empower Americans to: rate colleges based on what matters most to them, highlight colleges that are serving students of all backgrounds well, and to focus on making a quality, affordable education within reach.
New, comprehensive and updated data on higher education institutions. For the first time, the public can access the most reliable and comprehensive data on students’ outcomes at specific colleges, including former students’ earnings, graduates’ student debt, and borrowers’ repayment rates. The data is also available for various sub-groups, like first generation and Pell students. Because the data will be published through an API, researchers, policymakers, and members of the public can customize their own analysis of college performance more quickly and easily.
Customized tools for students, with 11 organizations already using the data to launch new tools. College search resources like ScholarMatch, StartClass and College Abacus are using this data to help students search for, compare, and develop a list of colleges that are the best choice for them and their families. PayScale, which offers consumers a large salary database, will use the new data to analyze various colleges’ return-on-investment for different student groups. InsideTrack, a team of coaches and consultants working to improve student outcomes, will use the data to develop and implement effective student-centered initiatives. ProPublica, a non-profit investigative journalism newsroom, has built a tool with the open data to help consumers make more informed decisions.
How we did it
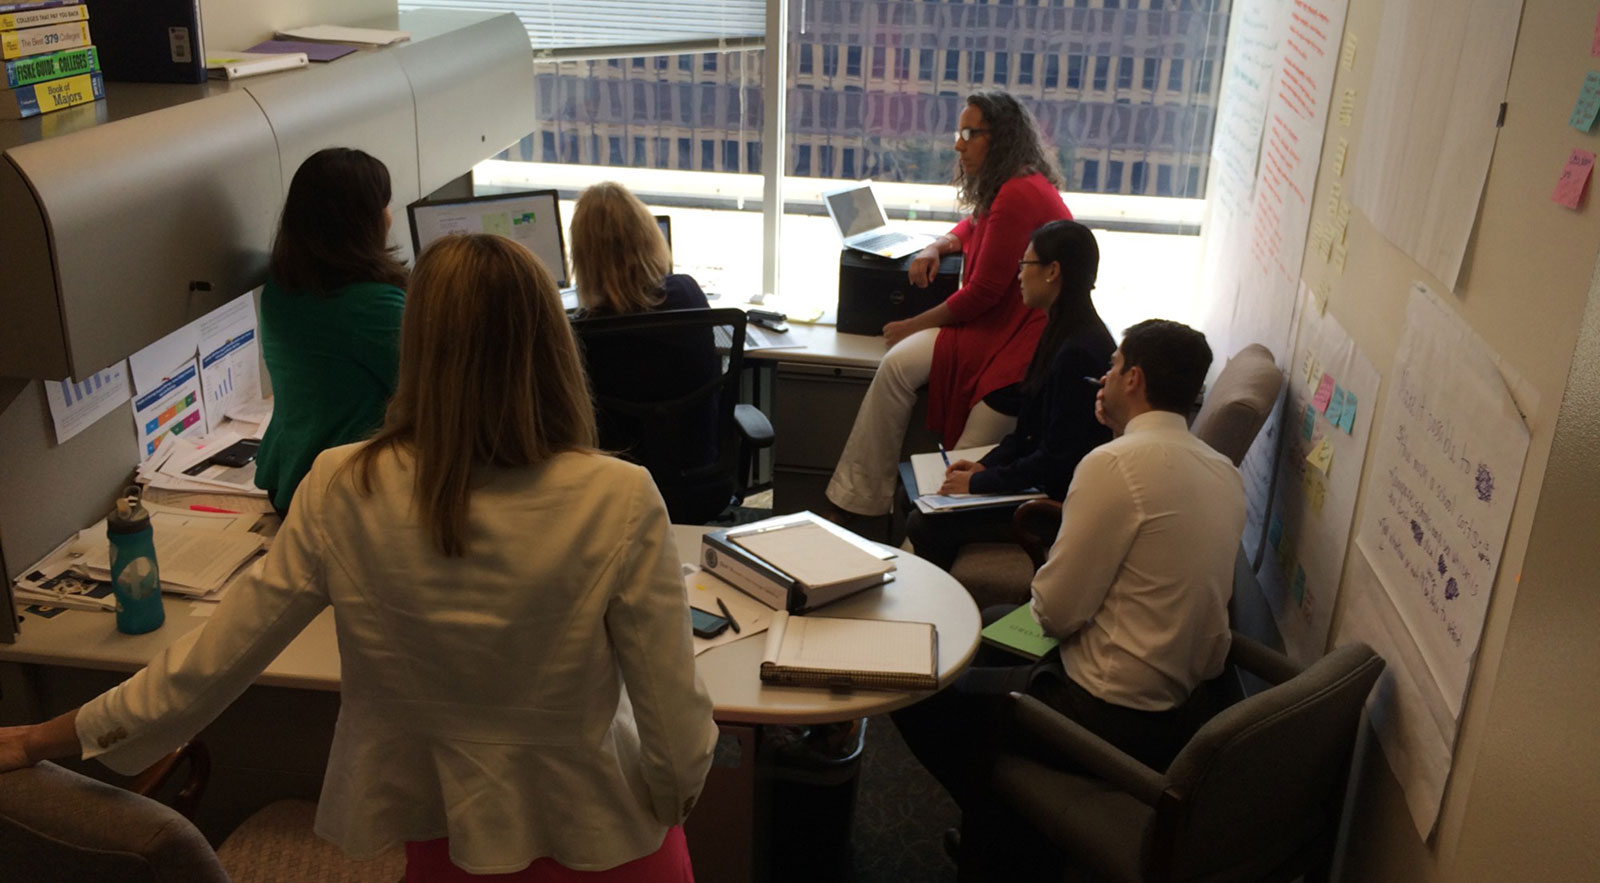 One of our many demos.
This was a truly collaborative team effort: thank you to the Department of Education, White House Domestic Policy Council, White House Council of Economic Advisors, Department of Treasury, Office of Management and Budget, 18F (at GSA) and the team at the U.S. Digital Service.
Here are two plays we kept in mind as we went through the process:
Build with, not for, users.
We knew what we needed to do: make people’s lives better by providing them the tools and information to make more informed choices and get the best bang for their buck. And we wondered — exactly how do people make choices when deciding on college?
Instead of guessing, we decided to go out and ask them.
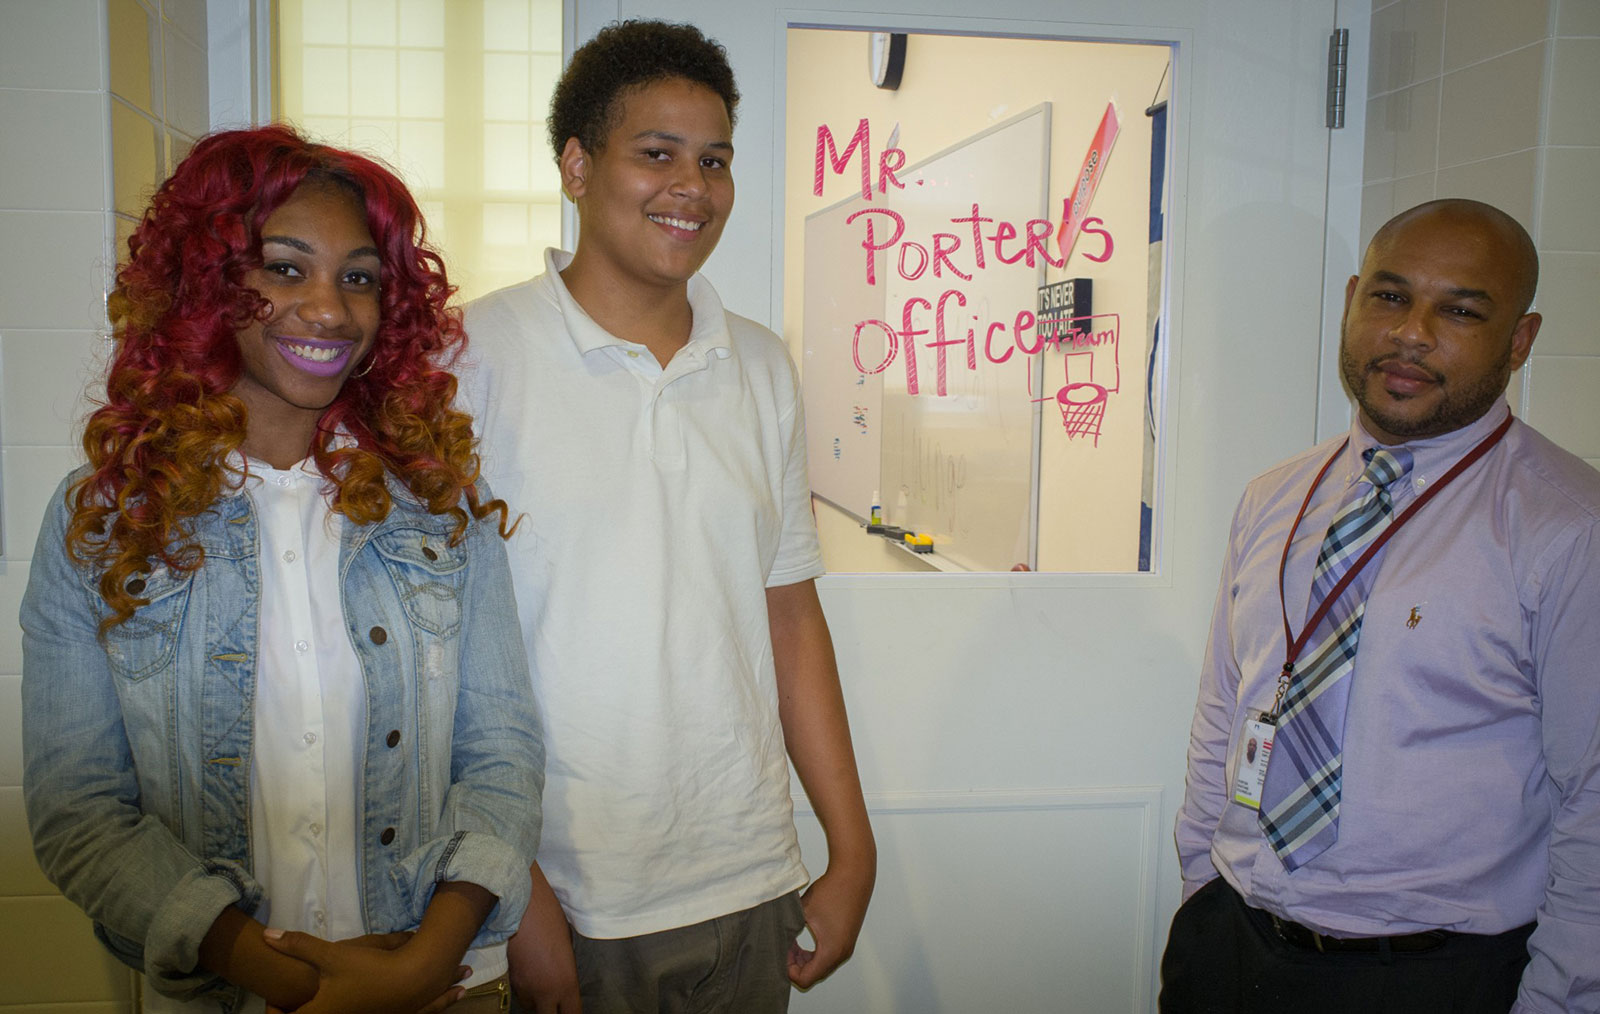 An amazing guidance counselor at Anacostia High with two of his students.
Following our practice of focusing on user needs, the College Scorecard team first spent time engaging directly with users at every single step in the project. Some of our favorite conversations were when we talked to high school students in Washington, D.C.’s Anacostia neighborhood and their excellent guidance counselor. He told us how he “hacks” the process to make sure every one of his students gets an acceptance letter from a college, and feels that rush of possibility.
We met with 38 4-H kids from across the country who were frustrated by inaccurate data on the college search tools they use to find the best agricultural programs today. We listened to a mom from Maryland explain that she shopped for schools based on the lowest annual actual cost to become a medical technician — her dream job. We even called a young woman who works as a college advisor in the Bronx, who had written a letter to the President with her ideas of how to make higher education data and tools work even better for her students. We also visited the newsrooms of data journalists to understand how they used higher education open data to report on how well schools were serving students.
We built on the hard work of the Department of Education; previously, they met with thousands of stakeholders from the higher education community to learn about their concerns and ideas and hopes for how we could help students and families make a more informed decision.
Be agile.
 Secretary of Education Arne Duncan sees the difference between the paper prototype and the mobile-friendly version of the College Scorecard.
Based on this research and input from the field, we made the cheapest, fastest prototype of the College Scorecard possible. We knew it needed to be mobile-first, simple, and easy to customize. That prototype ended up being a homemade, cardboard iPhone — slips of paper with wireframes of what the tool could look like. It probably cost less than a cup of coffee to produce.
We also went to work with the federal government’s data from over 7,000 schools, going back 18 years. We wanted to make the data usable by software developers and data scientists, so we put it into an open API that fuels the College Scorecard website. The API allows anyone to create tools and insights that will help prospective college students make these important decisions.
To make sure the data worked well and was clear, we engaged with a group of software developers and data scientists to be beta users of the data. In addition to the groups mentioned above, we’re also excited to see the tools and enhancements that Niche, College Greenlight, Noodle, Tractus Insight (HelloCollege) and I’m First! are working on — and are looking forward to what many others will be able to do with the data that’s now open and available.
What’s in the data
The datasets include information from the Department of Treasury on student loan repayment rates, and the IRS on post-graduation income. They encompass nearly 2,000 data points for over 7,000 schools going back 18 years. By combining new data from Department of Education and Department of Treasury with data that colleges already report on graduation rates, cost, and other descriptions about their school, the College Scorecard allows everyone to find the true value of attending college, including:
Employment outcomes: The College Scorecard contains the first-ever comprehensive and reliable data on post-college earnings for students who attended all types of undergraduate institutions, based upon tax records. While increased earnings are only one of many reasons to go to college, many students consider their future career prospects when making an investment in their education.
Specifically, the new Scorecard includes:
- The proportion of former students earning over $25,000, which is the average earnings of high school graduates, six years after enrolling, and
- The median earnings of students 10 years after they enroll in college.
Student-level outcomes data: The College Scorecard publishes data from the National Student Loan Data System (NSLDS), which the Department of Education has used to manage and track grants and loans since the 1990s. The data can be used to produce a variety of new institutional performance metrics including
- Median cumulative loan debt,
- Repayment rate, and
- Completion and transfer rates, all by various student sub-groups.
The demographic data includes things you might expect, like ethnicity or gender, as well as how many students are the first generation to attend college, their family income, and whether they’re taking out student loans or grants. We should point out that the Department of Education carefully aggregated this data at a high level, and does not include anything about an individual. Rather, the focus is on reporting how well schools do for students.
This is just the beginning. By giving developers access to an API, even more customized tools will be created, providing students more options than ever before to find the right school for them.
What this means for the marketplace
“The status quo serves some colleges and the companies that rank them just fine. But it doesn’t serve our students well — and that doesn’t serve any of us well. There are colleges dedicated to helping students of all backgrounds learn without saddling them with debt. We should hold everybody to that standard. Our economic future depends on it.” When students have more access to information, it means they can make better financial decisions for themselves and their families.
This is a huge win for students, families, and the marketplace — open data like this ensures that both colleges and students are operating in a more fair, competitive, and transparent environment.
It also means that a student like my niece now has more data than ever to help her make one of the best investments in her future — and I’m pretty excited about that.